Definition · infra

Observability

The ability to understand what your system is doing in production without shipping new code. Composed of logs, metrics, and traces. Most early-stage teams ship with bare-minimum logging and pay for it in 3 AM debugging sessions.

Glossary · infra
Observability
startmatter.com/glossary

Why this matters

Most pages defining "Observability" get it wrong.

Generic definitions, no specifics, no opinion. We define it the way a senior engineer explains it to a founder — with cost numbers, tradeoffs, and a real position.

The three pillars

  • Logs. Time-stamped text events. Used for individual-event debugging. "What did this request see?"
  • Metrics. Aggregated numerical measurements. Used for trends and alerting. "How many requests/sec? P99 latency?"
  • Traces. End-to-end request tracking across services. Used for performance debugging in distributed systems. "Where did the 4-second response time go?"
Real observability needs all three. You can debug one outage without traces if your system is simple enough — but you'll waste hours on each new outage that you could have spent shipping.

What most early-stage teams ship

Console.log statements scattered through the code. No structured logging. No metrics. Errors caught by Sentry (one of the few things teams actually wire up). When something breaks at 50 users, the founder spends a day understanding why.

What good looks like at MVP scale

Cheap, easy stack we ship with most MVPs:

  • Logs: structured JSON to stdout, captured by Vercel/Railway/your platform
  • Metrics: Vercel Analytics or PostHog for product, platform metrics for infra
  • Errors: Sentry from day one
  • Tracing: skip until you have a distributed system or async pipelines
  • Performance: Speed Insights or platform-native
Cost: $0–$50/month at MVP scale. Adding this on day one is much cheaper than retrofitting it after the first outage.

What you don't need at v1

  • Datadog, Honeycomb, or other enterprise APM platforms (overkill until you have $10K+/month of revenue per app)
  • Custom Grafana dashboards (most platforms have built-in dashboards good enough)
  • Multi-cloud observability (until you're multi-cloud, which usually you aren't)

What you do need from day one

A way to query historical logs (not just current tail). Errors aggregated and de-duplicated. The four golden signals: latency, traffic, errors, saturation. Without these you're flying blind.

Related

In the wild

Projects we shipped using observability

Real founders, real product, real testimonials. How this concept shows up in actual builds.

ArbVantage
Big Data Platform · 2026

ArbVantage

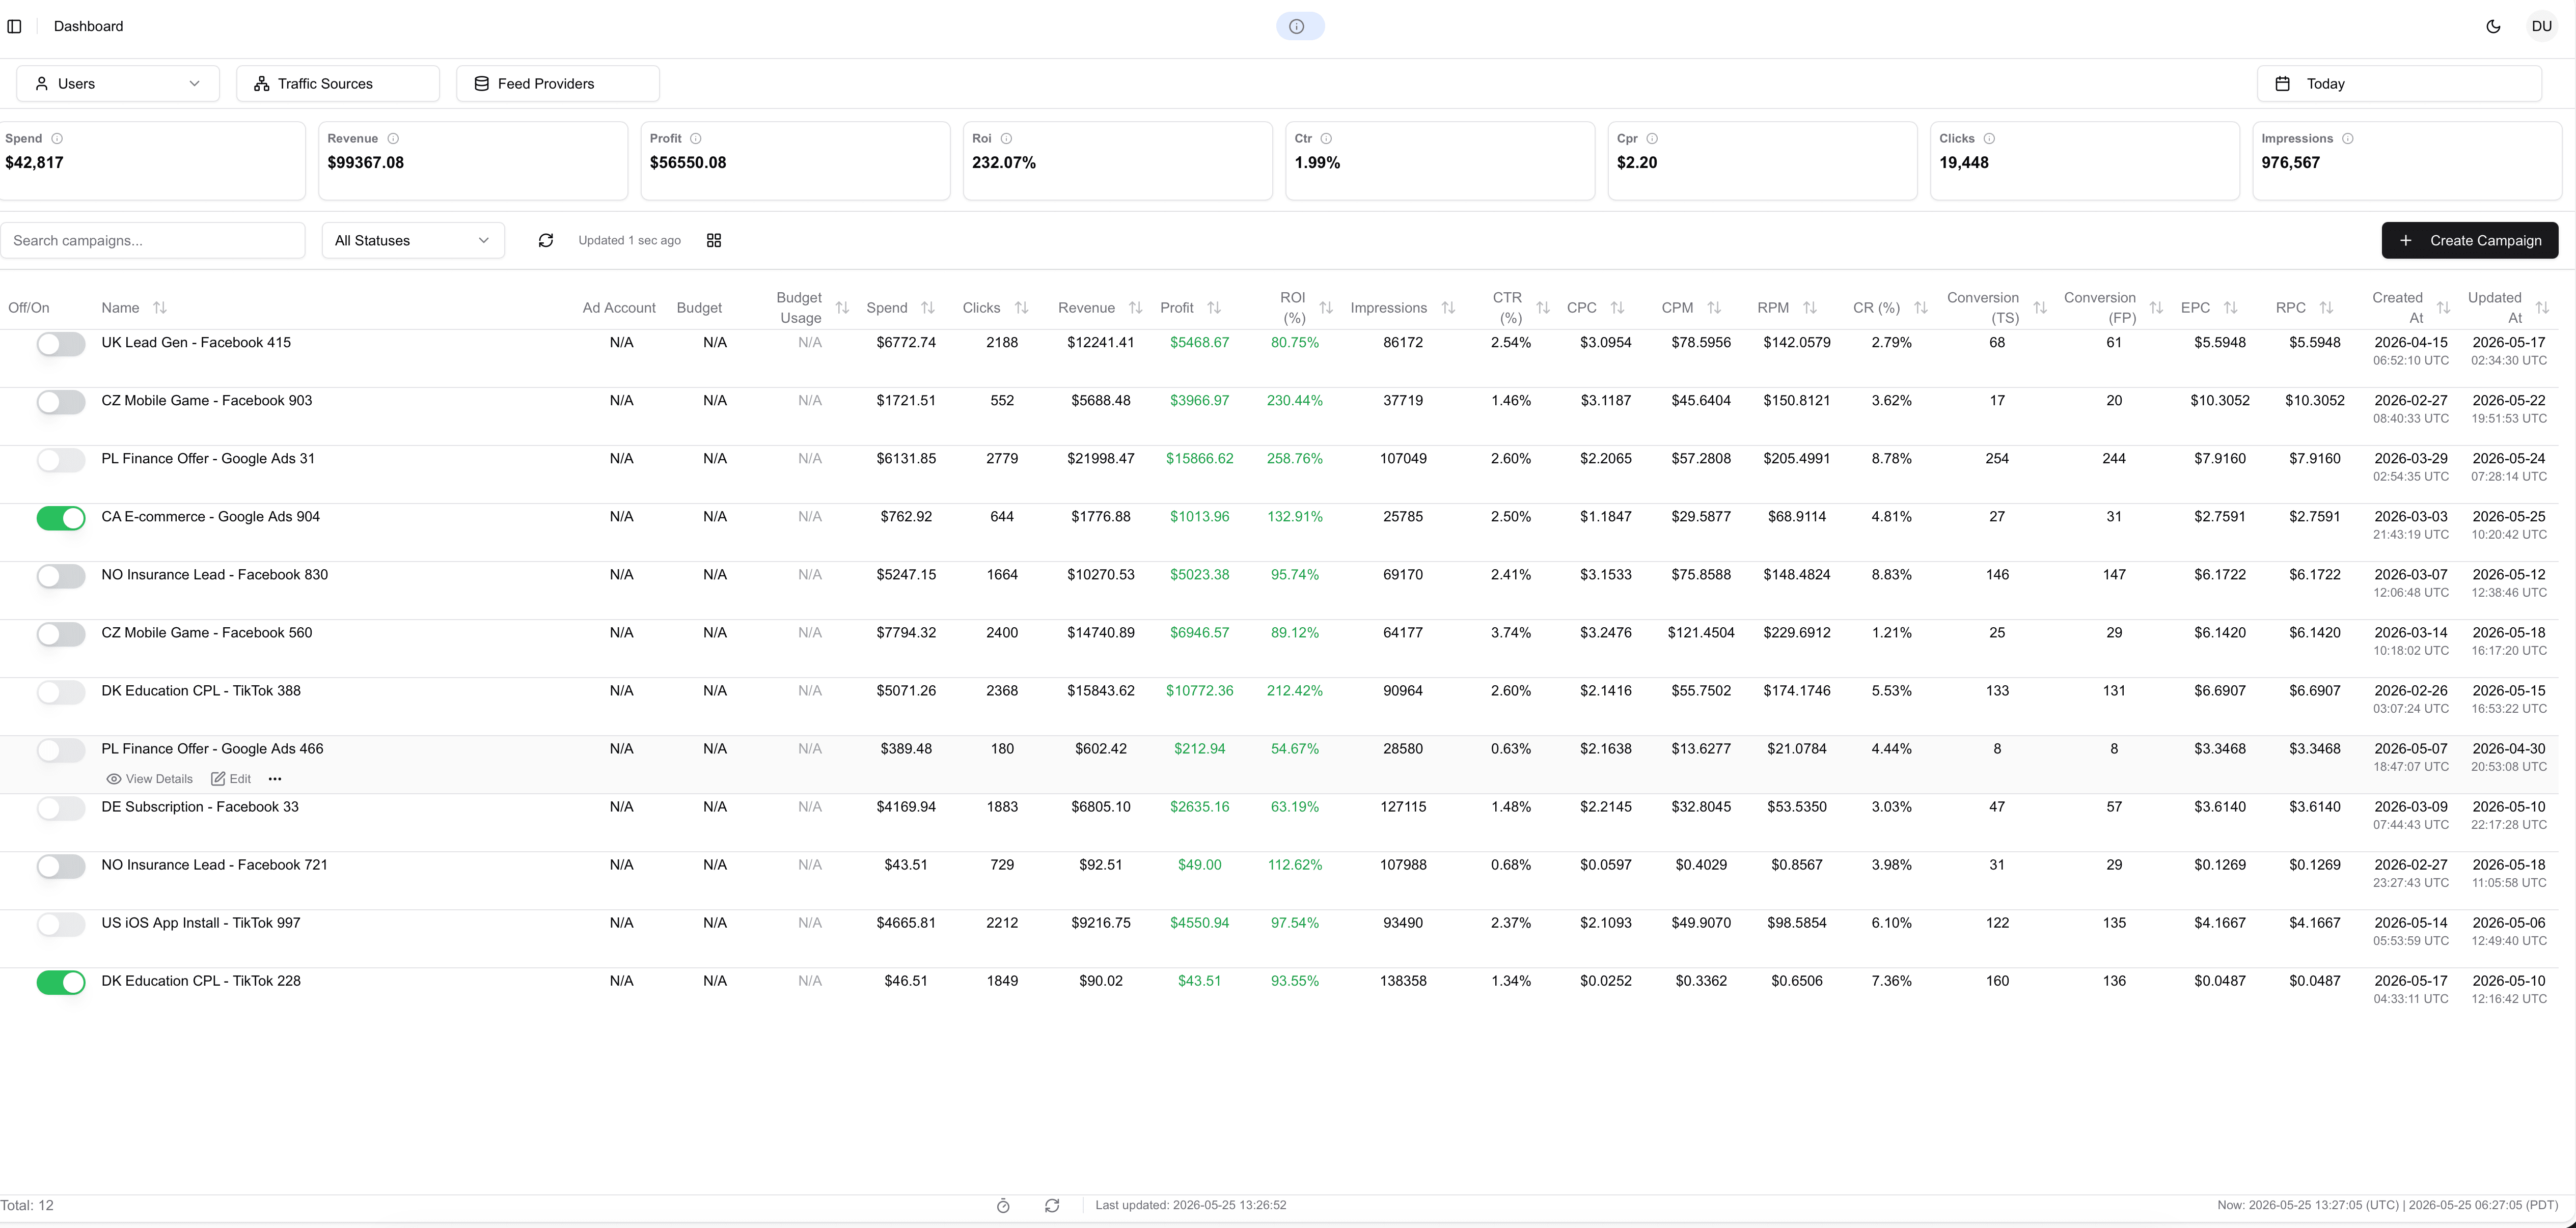
Big-data platform for traffic arbitrage in Facebook ads. Built for affiliate media buyers running large daily spend across CPA offers — campaign and creative management, spend analytics, and high-volume ad-account orchestration.

Visit the product
OLSP System
Affiliate Marketing Platform · 2025

OLSP System

All-in-one affiliate marketing platform with training, traffic tools, and pre-built funnels under a single tracking pixel. Members learn lead generation and earn commissions promoting OLSP's bundled digital products.

Visit the product
Campaign Refinery
SaaS Platform · 2024

Campaign Refinery

Campaign Refinery is an advanced email marketing and automation platform that focuses on helping businesses send better emails, improve deliverability, and drive real engagement. It combines powerful automation, smart list management, and deep analytics to make email campaigns more effective and easier to manage.

Visit the product

Apply this to your build

Definitions are theory.
We ship the practice.

30-minute call, flat-price quote in 24 hours, first deploy inside two weeks.